Arnaud Amsellem just publishes an exciting research using LOBSTER data. – Using random forest to model limit order book dynamic
MathWorks Publishes Machine Learning Applications Using LOBSTER Data

Evaluate Trading Strategies by Using LOBSTER Data
— A short review of a working paper by Balch et.al (2019) from J.P. Morgan Artificial Intelligence Research and Imperial College London
T.H. Balch et.al have published a working paper, “How to Evaluate Trading Strategies: Single Agent Market Replay or Multiple Agent Interactive Simulation?” In the paper, by using LOBSTER data they show how a multi-agent simulator can support two important but distinct methods for assessing a trading strategy: Market Replay (backtesting) and Interactive Agent-Based Simulation (IABS).
In particular, they implement backtesting using three agents: An exchange agent representing the exchange which keeps the order book (e.g., Nasdaq or NYSE), a market replay agent that provides
liquidity by replaying historical orders and an experimental agent representing the trading strategy to be evaluated. While the experimental agent is based on an interactive agent-based simulator named as ABIDES, the market replay agent is based on LOBSTER message data. The authors visualize a short segment of the replay data in Figure 2 in the paper,
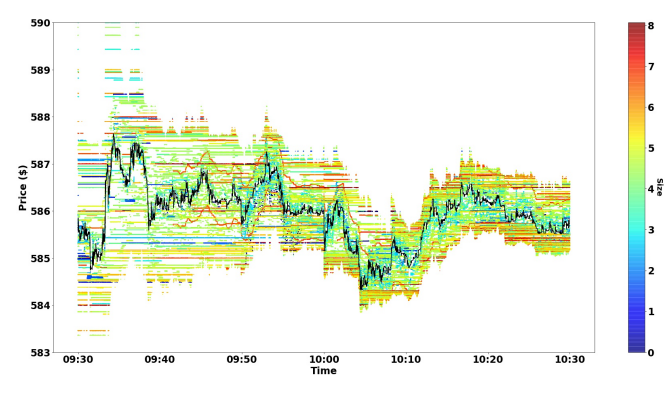

The experimental agent is configured to participate in the simulation in a manner similar to the market replay agent, with the orders submitted dependent on the experiment carried out. She uses a strategic “greed” parameter to determine what size order to place relative to the available liquidity. In the visualized experiment, the impact agent queries liquidity within 1% of the inside bid (if selling) or ask (if buying) and with greed = 1.0 places an order to capture all of it. [How exactly the greed level is defined is not very clear for me.]
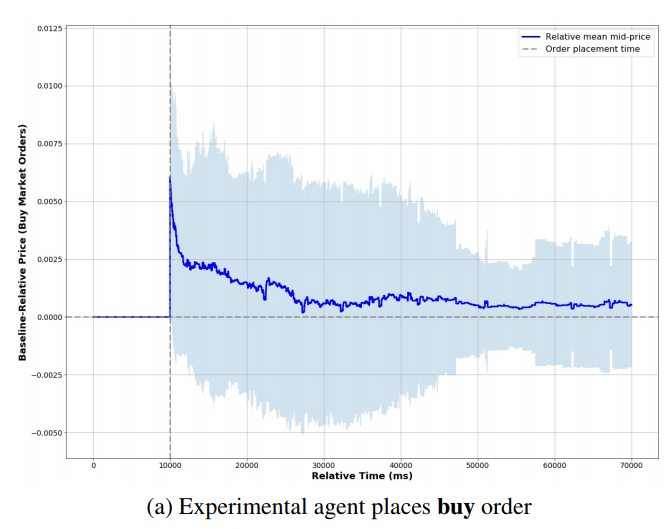

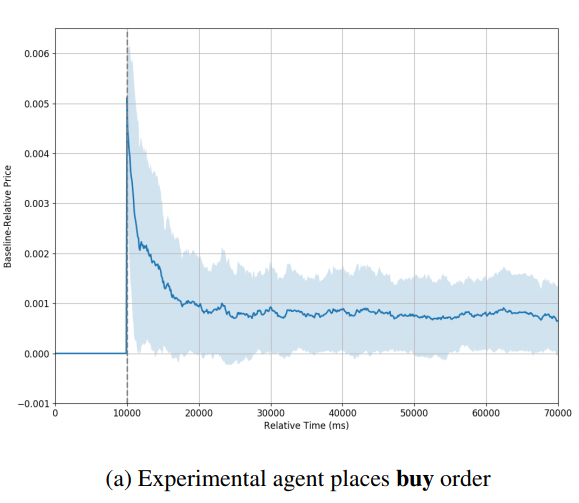
The above two figures show the typical simulation result observed by the authors. They conclude that in the backtesting environment the price trends rather quickly back to the baseline price, eventually reaching that price and remaining there [the authors also point out that whether the price finally stabilized at the baseline price seems to depend on the trading side. Although by looking their figures, I can not see this clearly.] . However, in the IABS experiments, the price stabilizes at a new level in each set of experiments, suggesting that the impact of the order is longer lasting or even permanent.
Lobster Data Demo Codes
Great news! Demo codes on processing lobster data by using various programming languages are available in Internet.
- LOBSTER parser in Google Go by Dan Cline from MIT, is available at here.
- LOBSTER demo code in Python by Arnaud Amsellem, an independent quant trader, is available at here .
Many thanks to the contributors.
Information of Liquidity Deeply in the Order Book
Although LOBSTER has the capability to generate the entire limit order book, it is currently restricted to a maximum of 200 quote level. As a result a frequently asked question is “Why can’t I generate the whole book?” Besides the data size consideration, the main rational behind this decision is that the liquidity deeply in the book is not likely to be informative.
First, algorithmic traders are not likely to react to deep liquidity, because:
- the market data feed of most of trading platform in the industry do not provide the full book information, and
- it is not optimal for algorithmic trading strategy to react to deep liquidity – Taking advantage of its speed, the algorithm gets enough time to react when the liquidity is showing up close to the market, say in 5 to 20 quote levels. A model taking an action when the liquidity is still hundreds of levels behind the market, disregarding the platform’s low-latency advantage, is clearly sub-optimal (originally, I use adjective “stupid” which is impolite but likely more proper).
Second, the lower frequency traders are incapable to rationally react to deep liquidity, since
- most of them do not have the data feed, and
- a human being can hardly analyse more than ten level quotes in a timely fashion.
Third, the deep liquidity in book is typically from uninformative sources:
- low-frequency traders who lack the capability to monitor the market in real time, and
- the market markers who are obligated to quote on both sides but are not willing to trade on either or both sides.
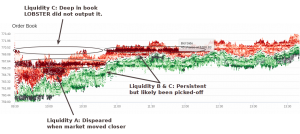
The the above screen shot from Ivo Zeba’s LOBSTER visualisation tool shows the liquidity distribution and price dynamics over a period.
- Liquidity A was closed monitored and could be potentially informative in its first showing-up in the book. Since it was in low levels, LOBSTER outputted it “on time”.
- Liquidity B was in the mid-range in the book, LOBSTER outputted it. But it might not be really informative for price prediction at its first showing-up.
- Like liquidity B, liquidity C was also very persistent and getting picked-off. It had not been outputted at the time of showing-up. However, LOBSTER did output it early enough for its price impact into the consideration for a meaningful model.