Arnaud Amsellem just publishes an exciting research using LOBSTER data. – Using random forest to model limit order book dynamic
Evaluate Trading Strategies by Using LOBSTER Data
— A short review of a working paper by Balch et.al (2019) from J.P. Morgan Artificial Intelligence Research and Imperial College London
T.H. Balch et.al have published a working paper, “How to Evaluate Trading Strategies: Single Agent Market Replay or Multiple Agent Interactive Simulation?” In the paper, by using LOBSTER data they show how a multi-agent simulator can support two important but distinct methods for assessing a trading strategy: Market Replay (backtesting) and Interactive Agent-Based Simulation (IABS).
In particular, they implement backtesting using three agents: An exchange agent representing the exchange which keeps the order book (e.g., Nasdaq or NYSE), a market replay agent that provides
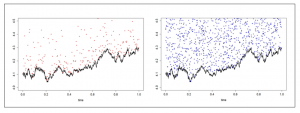
liquidity by replaying historical orders and an experimental agent representing the trading strategy to be evaluated. While the experimental agent is based on an interactive agent-based simulator named as ABIDES, the market replay agent is based on LOBSTER message data. The authors visualize a short segment of the replay data in Figure 2 in the paper,
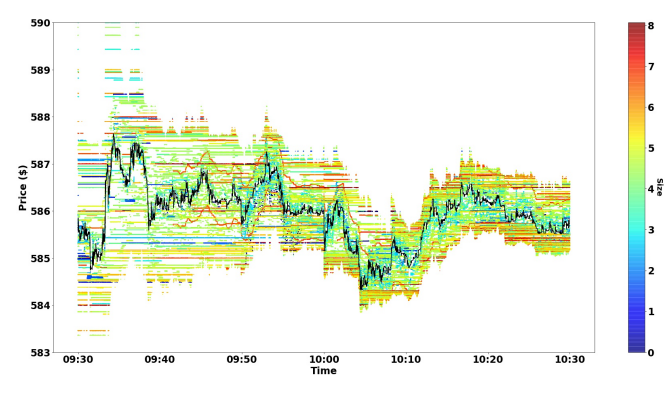

The experimental agent is configured to participate in the simulation in a manner similar to the market replay agent, with the orders submitted dependent on the experiment carried out. She uses a strategic “greed” parameter to determine what size order to place relative to the available liquidity. In the visualized experiment, the impact agent queries liquidity within 1% of the inside bid (if selling) or ask (if buying) and with greed = 1.0 places an order to capture all of it. [How exactly the greed level is defined is not very clear for me.]
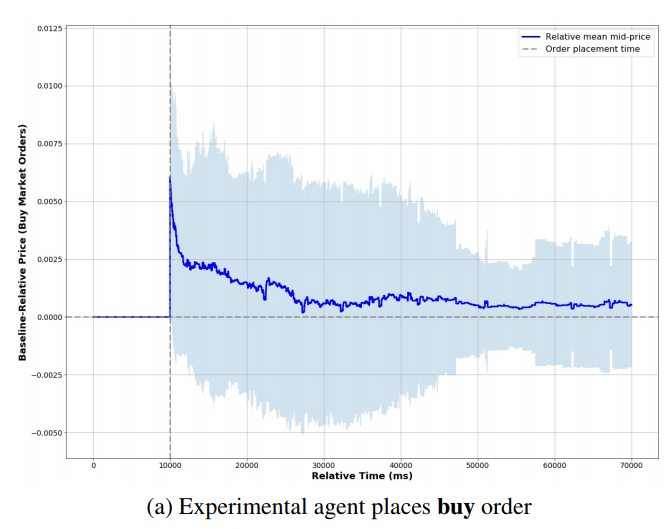

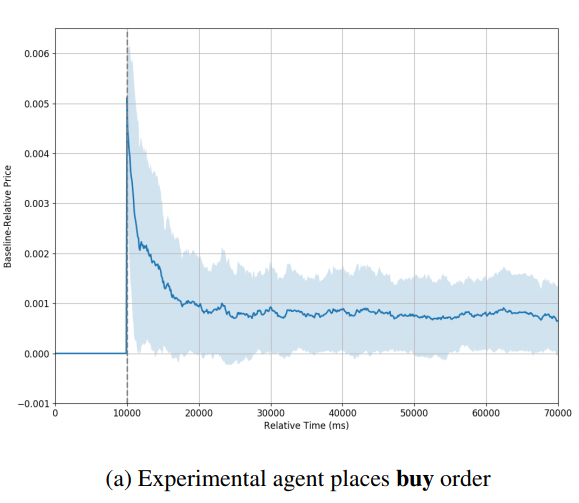
The above two figures show the typical simulation result observed by the authors. They conclude that in the backtesting environment the price trends rather quickly back to the baseline price, eventually reaching that price and remaining there [the authors also point out that whether the price finally stabilized at the baseline price seems to depend on the trading side. Although by looking their figures, I can not see this clearly.] . However, in the IABS experiments, the price stabilizes at a new level in each set of experiments, suggesting that the impact of the order is longer lasting or even permanent.
Lobster Data Demo Codes
Great news! Demo codes on processing lobster data by using various programming languages are available in Internet.
- LOBSTER parser in Google Go by Dan Cline from MIT, is available at here.
- LOBSTER demo code in Python by Arnaud Amsellem, an independent quant trader, is available at here .
Many thanks to the contributors.
Estimation of the discontinuous leverage effect: Evidence from the NASDAQ order book
Markus Bibinger from the University of Marburg, Christopher Neely from the Federal Reserve Bank of St. Louis and Lars Winkelmann from Free University Berlin published a paper using LOBSTER data. It is titled Estimation of the discontinuous leverage effect: Evidence from the NASDAQ order book and is forthcoming in the Journal of Econometrics.
Abstract: An extensive empirical literature documents a generally negative relation, named the “leverage effect,” between asset returns and changes of volatility. It is more challenging to establish such a return–volatility relationship for jumps in high-frequency data. We propose new nonparametric methods to assess and test for a discontinuous leverage effect — i.e. a covariation between contemporaneous jumps in prices and volatility. The methods are robust to market microstructure noise and build on a newly developed price-jump localization and estimation procedure. Our empirical investigation of six years of transaction data from 320 NASDAQ firms displays no unconditional negative covariation between price and volatility cojumps. We show, however, that there is a strong and significant discontinuous leverage effect if one conditions on the sign of price jumps and whether the price jumps are market-wide or idiosyncratic.
You can find the article here.
Information of Liquidity Deeply in the Order Book
Although LOBSTER has the capability to generate the entire limit order book, it is currently restricted to a maximum of 200 quote level. As a result a frequently asked question is “Why can’t I generate the whole book?” Besides the data size consideration, the main rational behind this decision is that the liquidity deeply in the book is not likely to be informative.
First, algorithmic traders are not likely to react to deep liquidity, because:
- the market data feed of most of trading platform in the industry do not provide the full book information, and
- it is not optimal for algorithmic trading strategy to react to deep liquidity – Taking advantage of its speed, the algorithm gets enough time to react when the liquidity is showing up close to the market, say in 5 to 20 quote levels. A model taking an action when the liquidity is still hundreds of levels behind the market, disregarding the platform’s low-latency advantage, is clearly sub-optimal (originally, I use adjective “stupid” which is impolite but likely more proper).
Second, the lower frequency traders are incapable to rationally react to deep liquidity, since
- most of them do not have the data feed, and
- a human being can hardly analyse more than ten level quotes in a timely fashion.
Third, the deep liquidity in book is typically from uninformative sources:
- low-frequency traders who lack the capability to monitor the market in real time, and
- the market markers who are obligated to quote on both sides but are not willing to trade on either or both sides.
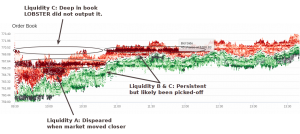
The the above screen shot from Ivo Zeba’s LOBSTER visualisation tool shows the liquidity distribution and price dynamics over a period.
- Liquidity A was closed monitored and could be potentially informative in its first showing-up in the book. Since it was in low levels, LOBSTER outputted it “on time”.
- Liquidity B was in the mid-range in the book, LOBSTER outputted it. But it might not be really informative for price prediction at its first showing-up.
- Like liquidity B, liquidity C was also very persistent and getting picked-off. It had not been outputted at the time of showing-up. However, LOBSTER did output it early enough for its price impact into the consideration for a meaningful model.
Volatility estimation under one-sided errors with applications to limit order books
Markus Bibinger from the University of Marburg, Moritz Jirak, from TU Braunschweig and Markus Reiss from Humboldt University Berlin, published a paper using Lobster data. It is titled Volatility estimation under one-sided errors with applications to limit order books and is forthcoming in Annals of Applied Probability.
Abstract: For a semi-martingale X_t, which forms a stochastic boundary, a rate-optimal estimator for its quadratic variation ⟨X,X⟩_t is constructed based on observations in the vicinity of X_t. The problem is embedded in a Poisson point process framework, which reveals an interesting connection to the theory of Brownian excursion areas. We derive n^−1/3 as optimal convergence rate in a high-frequency framework with n observations (in mean). We discuss a potential application for the estimation of the integrated squared volatility of an efficient price process X_t from intra-day order book quotes.
A working paper version is found here.
Estimating Spot Cross-Correlations in Asset Returns
Markus Bibinger from the University of Marburg, Nikolaus Hautsch from the University of Vienna, Peter Malec from the University of Cambridge and Markus Reiss from Humboldt University Berlin published a paper using LOBSTER data. It is titled Estimating the Spot Covariation of Asset Prices — Statistical Theory and Empirical Evidence and is forthcoming in the Journal of Business and Economic Statistics.
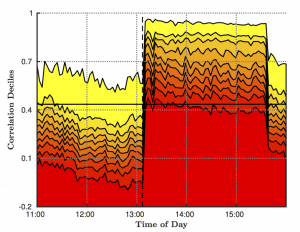
Abstract: We propose a new estimator for the spot covariance matrix of a multi-dimensional continuous semi-martingale log asset price process which is subject to noise and non-synchronous observations. The estimator is constructed based on a local average of block-wise parametric spectral covariance estimates. The latter originate from a local method of moments (LMM) which recently has been introduced by Bibinger et al (2014). We prove consistency and a point-wise stable central limit theorem for the proposed spot covariance estimator in a very general setup with stochastic volatility, leverage effects and general noise distributions. Moreover, we extend the LMM estimator to be robust against autocorrelated noise and propose a method to adaptively infer the autocorrelations from the data. Based on simulations we provide empirical guidance on the effective implementation of the estimator and apply it to high-frequency data of a cross-section of Nasdaq blue chip stocks. Employing the estimator to estimate spot covariances, correlations and volatilities in normal but also unusual periods yields novel insights into intraday covariance and correlation dynamics. We show that intraday (co-)variations (i) follow underlying periodicity patterns, (ii) reveal substantial intraday variability associated with (co-)variation risk, and (iii) can increase strongly and nearly instantaneously if new information arrives.
A working paper version is found here.
Volatility, Information Feedback and Market Microstructure Noise: A Tale of Two Regimes
Torben G. Andersen from Northwestern University, Gökhan Cebiroglu and Nikolaus Hautsch, both from the University of Vienna, published a CFS working paper using LOBSTER data, titled Volatility, Information Feedback and Market Microstructure Noise: A Tale of Two Regimes.
Abstract: We extend the classical “martingale-plus-noise” model for high-frequency prices by an error correction mechanism originating from prevailing mispricing. The speed of price reversal is a natural measure for informational efficiency. The strength of the price reversal relative to the signal-to-noise ratio determines the signs of the return serial correlation and the bias in standard realized variance estimates. We derive the model’s properties and locally estimate it based on mid-quote returns of the NASDAQ 100 constituents. There is evidence of mildly persistent local regimes of positive and negative serial correlation, arising from lagged feedback effects and sluggish price adjustments. The model performance is decidedly superior to existing stylized microstructure models. Finally, we document intraday periodicities in the speed of price reversion and noise-to-signal ratios.
Read the working paper version here.
Optimal order display in limit order markets with liquidity competition
Gökhan Cebiroğlu and Ulrich Horst of Universität Wien and Humboldt-Universität zu Berlin published and Article in April 2015) with the titel Optimal order display in limit order markets with liquidity competition using LOBSTER data. Abstract:
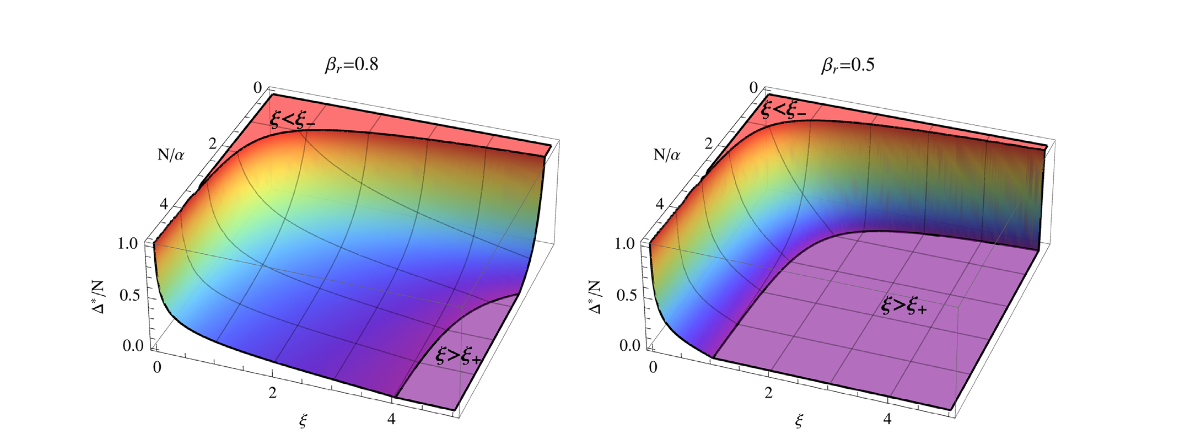
Order display is associated with benefits and costs. Benefits arise from increased execution-priority, while costs are due to adverse market impact. We analyze a structural model of optimal order placement that captures trade-off between the costs and benefits of order display. For a benchmark model of pure liquidity competition, we give a closed-form solution for optimal display sizes. We show that competition in liquidity supply incentivizes the use of hidden orders to prevent losses due to over-bidding. Thus, because aggressive liquidity competition is more prevalent in liquid stocks, our model predicts that the proportion of hidden liquidity is higher in liquid markets. Our theoretical considerations ares supported by an empirical analysis using high-frequency order-message data from NASDAQ. We find that there are no benefits in hiding orders in il-liquid stocks, whereas the performance gains can be significant in liquid stocks.
Latency and Liquidity Provision in a Limit Order Book

Julius Bonart and Martin Gould of Imperial College London published an Article in (April 2017) using LOBSTER data titled Latency and Liquidity Provision in a Limit Order Book. Abstract:
We use a recent, high-quality data set from Nasdaq to perform an empirical analysis of order flow in a limit order book (LOB) before and after the arrival of a market order. For each of the stocks that we study, we identify a sequence of distinct phases across which the net flow of orders differs considerably. We note some of our results are consist with the widely reported phenomenon of stimulated refill, but that others are not. We therefore propose alternative mechanical and strategic motivations for the behaviour that we observe. Based on our findings, we argue that strategic liquidity providers consider both adverse selection and expected waiting costs when deciding how to act.
http://dx.doi.org/10.1080/14697688.2017.1296177
Read the working paper version here.